参考文档:http://www.haiyun.me/category/nagios/
Nagios之web界面管理工具Nagiosql安装
发布时间:June 4, 2012 // 分类:Nagios // No Comments
NagiosQL是一个基于Web界面的Nagios配置管理工具,极大方便Nagios的使用、管理。
下载安装Nagiosql:
cd /var/www/html/
wget http://nchc.dl.sourceforge.net/project/nagiosql/nagiosql/NagiosQL%203.2.0/nagiosql_320.tar.gz
tar zxvf nagiosql_320.tar.gz
mv nagiosql32/ nagiosql
chmod -R 777 /var/www/html/nagiosql/config/
目录权限配置:
mkdir -p /etc/nagiosql/backup/hosts
mkdir -p /etc/nagiosql/backup/services
mkdir -p /etc/nagiosql/hosts
mkdir -p /etc/nagiosql/services
chown -R nagios:apache /etc/nagiosql/
chown -R nagios:apache /usr/local/nagios/etc/
chown nagios:apache /usr/local/nagios/bin/nagios
chown nagios:apache /usr/local/nagios/var/rw/nagios.cmd
chown -R nagios:apache /usr/local/nagios/var/spool/checkresults
编辑nagios配置文件,注释以cfg开头的配置,并添加:
vim /usr/local/nagios/etc/nagios.cfg
## Timeperiods
cfg_file=/etc/nagiosql/timeperiods.cfg
## Commands
cfg_file=/etc/nagiosql/commands.cfg
## Contacts
cfg_file=/etc/nagiosql/contacts.cfg
cfg_file=/etc/nagiosql/contactgroups.cfg
cfg_file=/etc/nagiosql/contacttemplates.cfg
## Hosts
cfg_dir=/etc/nagiosql/hosts
cfg_file=/etc/nagiosql/hosttemplates.cfg
cfg_file=/etc/nagiosql/hostgroups.cfg
cfg_file=/etc/nagiosql/hostextinfo.cfg
cfg_file=/etc/nagiosql/hostescalations.cfg
cfg_file=/etc/nagiosql/hostdependencies.cfg
## Services
cfg_dir=/etc/nagiosql/services
cfg_file=/etc/nagiosql/servicetemplates.cfg
cfg_file=/etc/nagiosql/servicegroups.cfg
cfg_file=/etc/nagiosql/serviceextinfo.cfg
cfg_file=/etc/nagiosql/serviceescalations.cfg
cfg_file=/etc/nagiosql/servicedependencies.cfg
访问http://server/nagiosql/install进入安装界面,可选中文语言: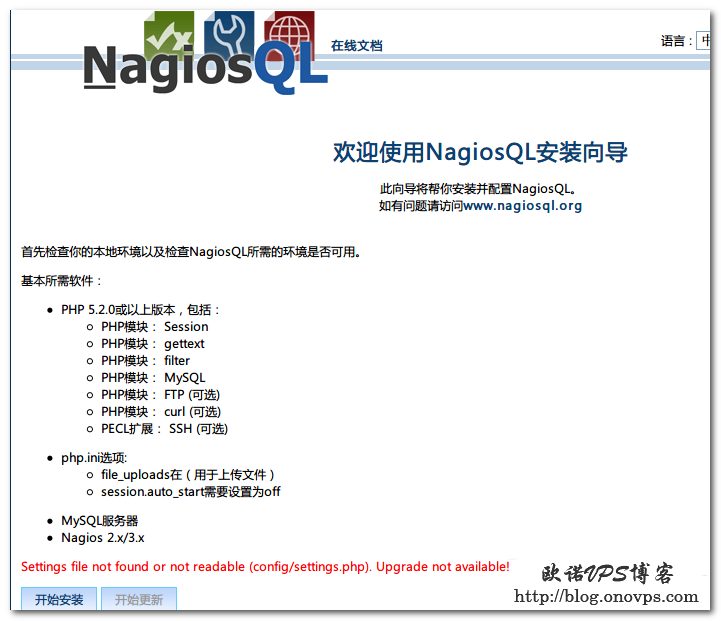
当前环境检测,全绿为通过: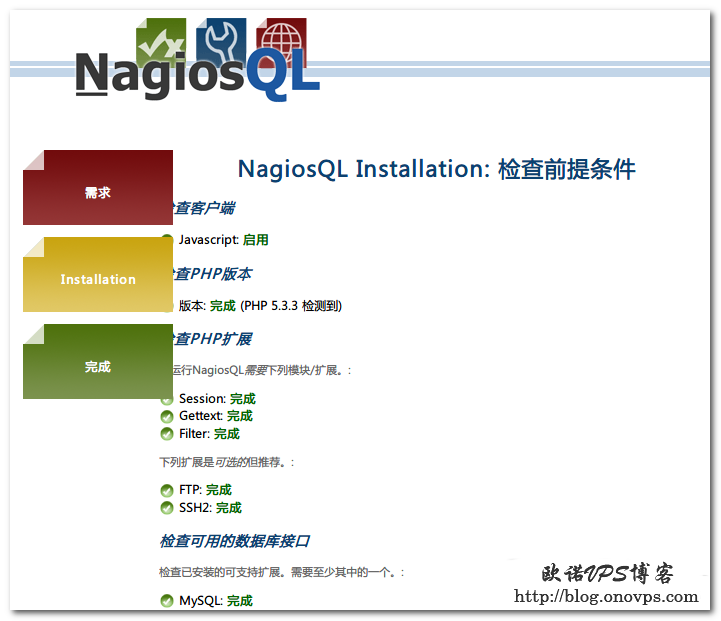
填写配置信息: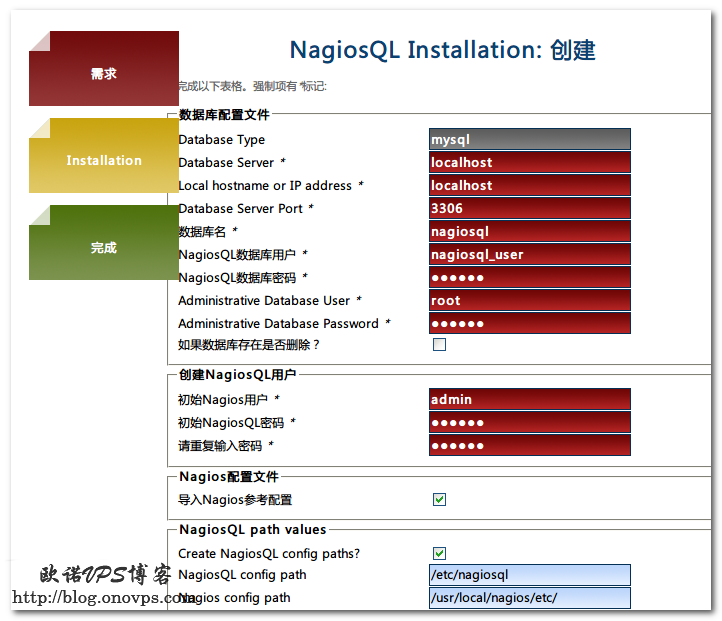
不出意外会提示安装成功,删除安装文件,进入登录界面: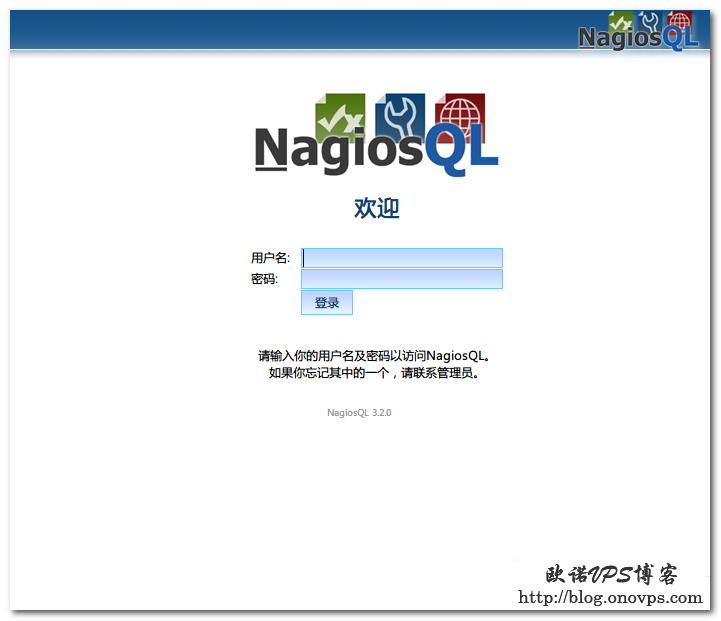
配置nagios相关目录,界面——管理——Config targets——localhost——编辑: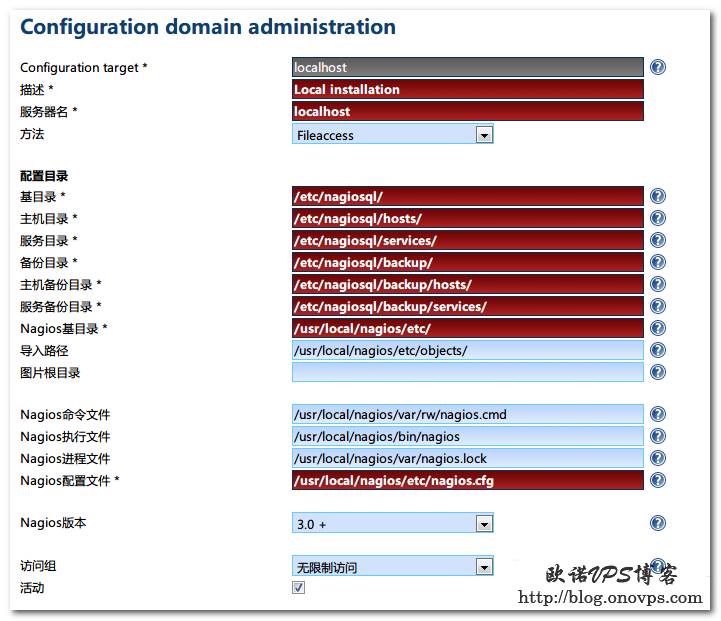
导入nagios配置: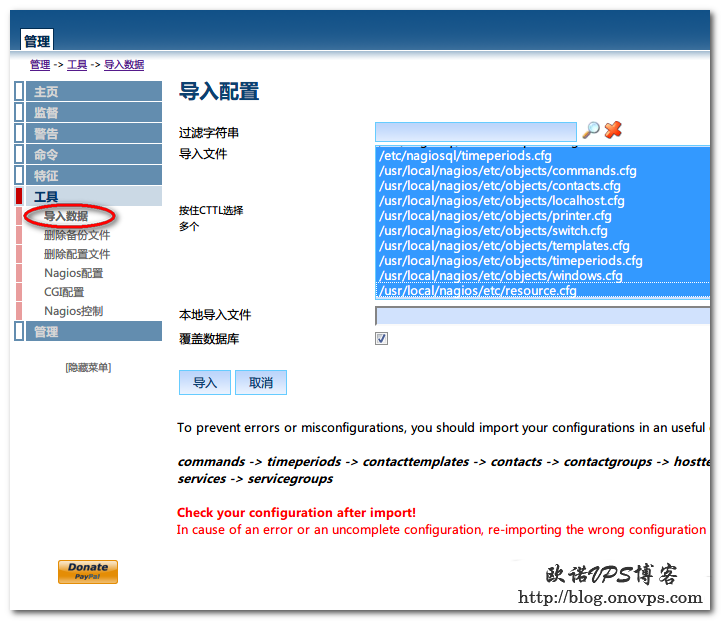
写入数据: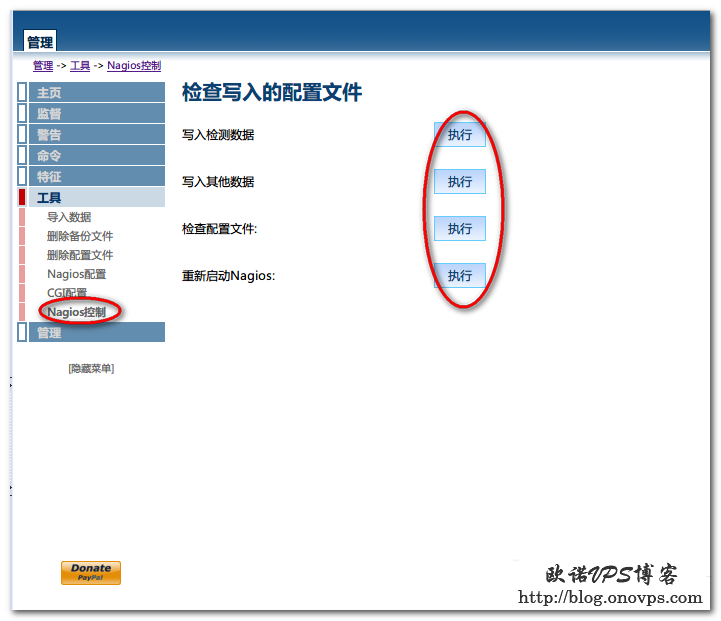
Nagios配置pnp4nagios支持图表显示
发布时间:June 3, 2012 // 分类:Nagios // No Comments
Nagios配合pnp4nagios可实现类似Cacti的图表显示,便于管理和分析服务器运行状况。
Nagios安装请参考:http://www.haiyun.me/archives/centos-install-nagios.html
安装rrdtool,需安装epel源:
#http://www.haiyun.me
yum install rrdtools perl-rrdtool perl-Time-HiRes
安装php4nagios:
wget http://nchc.dl.sourceforge.net/project/pnp4nagios/PNP-0.6/pnp4nagios-0.6.17.tar.gz
tar zxvf pnp4nagios-0.6.17.tar.gz
cd pnp4nagios-0.6.17
./configure --with-nagios-user=nagios --with-nagios-group=nagios
make all
make install
make install-webconf
make install-config
make install-init
#make fullinstall #相当于上面3个指令
配置php4nagios:
#http://www.haiyun.me
cd /usr/local/pnp4nagios/etc/
mv misccommands.cfg-sample misccommands.cfg
mv rra.cfg-sample rra.cfg
mv nagios.cfg-sample nagios.cfg
cd pages/
mv web_traffic.cfg-sample web_traffic.cfg
cd ../check_commands/
mv check_all_local_disks.cfg-sample check_all_local_disks.cfg
mv check_nrpe.cfg-sample check_nrpe.cfg
mv check_nwstat.cfg-sample check_nwstat.cfg
/etc/init.d/npcd start
chkconfig npcd on
配置Nagios数据输出接口:
vim /usr/local/nagios/etc/nagios.cfg
process_performance_data=1 #默认为0,修改为1
host_perfdata_command=process-host-perfdata #注释开头#号
service_perfdata_command=process-service-perfdata #注释开头#号
替换commands.cfg命令process-service-perfdata为以下内容:
vim /usr/local/nagios/etc/objects/commands.cfg
# 'process-host-perfdata' command definition
define command{
command_name process-host-perfdata
command_line /usr/local/pnp4nagios/libexec/process_perfdata.pl -d HOSTPERFDATA
}
# 'process-service-perfdata' command definition
define command{
command_name process-service-perfdata
command_line /usr/local/pnp4nagios/libexec/process_perfdata.pl
}
在模板配置文件中添加图表图标模板:
#http://www.haiyun.me
vim /usr/local/nagios/etc/objects/templates.cfg
define host {
name host-pnp
action_url /pnp4nagios/index.php/graph?host=$HOSTNAME$&srv=_HOST_' class='tips' rel='/pnp4nagios/index.php/popup?host=$HOSTNAME$&srv=_HOST_
register 0
}
define service {
name service-pnp
action_url /pnp4nagios/index.php/graph?host=$HOSTNAME$&srv=$SERVICEDESC$' class='tips' rel='/pnp4nagios/index.php/popup?host=$HOSTNAME$&srv=$SERVICEDESC$
register 0
}
复制鼠标悬停图标显示文件:
cp /usr/local/pnp4nagios/contrib/ssi/* /usr/local/nagios/share/ssi/
在监控主机或服务中调用图表模板:
define host{
use linux-server,host-pnp
host_name localhost
alias localhost
address 127.0.0.1
}
define service{
use local-service,service-pnp
host_name localhost
service_description PING
check_command check_ping!100.0,20%!500.0,60%
}
define service{
use local-service,service-pnp
host_name localhost
service_description Root Partition
check_command check_local_disk!20%!10%!/
}
重启nagios,访问nagios界面即可看到图表小图标: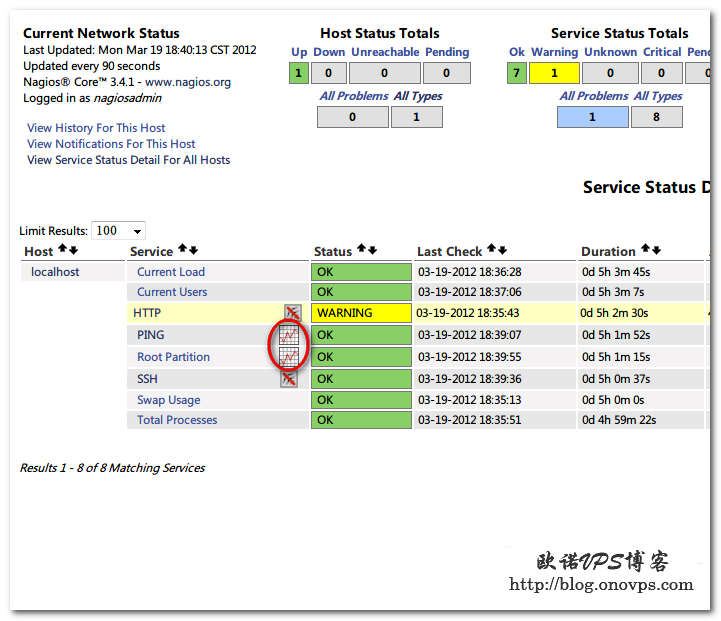
点击图标会显示pnp4nagios测试页面: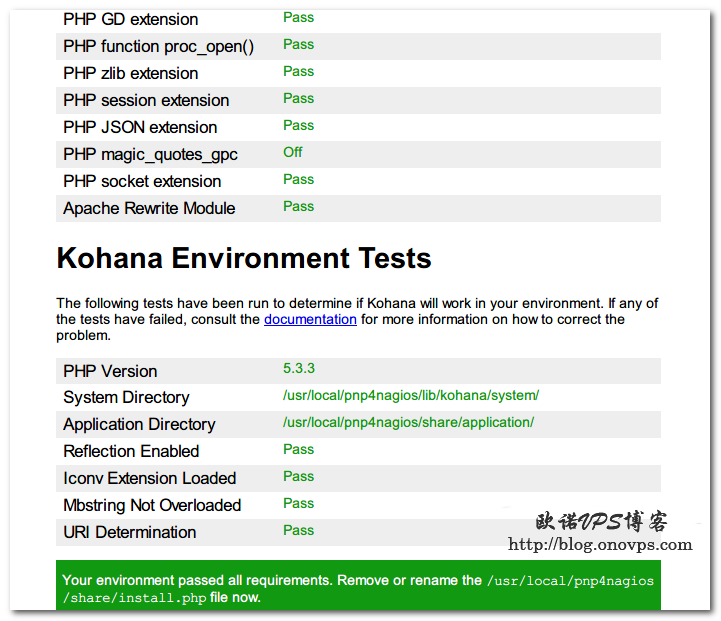
全是绿色代表配置正常,然后移除或修改install.php文件:
1
rm -rf /usr/local/pnp4nagios/share/install.php
再次点击图标就会显示当前监控服务由pnp4nagios生成的图表了:
注意 : 其实上面测试是没数据的 而且还会一直报错
May 3 23:39:29 localhost nagios: wproc: SERVICE PERFDATA job 0 from worker Core Worker 102132 is a non-check helper but exited with return code 2
May 3 23:39:29 localhost nagios: wproc: early_timeout=0; exited_ok=1; wait_status=512; error_code=0;
May 3 23:39:29 localhost nagios: Worker 102132: Unknown jobtype: 10
May 3 23:39:29 localhost nagios: wproc: Unknown job type: 10
May 3 23:39:31 localhost nagios: wproc: SERVICE PERFDATA job 0 from worker Core Worker 102131 is a non-check helper but exited with return code 2
May 3 23:39:31 localhost nagios: wproc: early_timeout=0; exited_ok=1; wait_status=512; error_code=0;
May 3 23:39:31 localhost nagios: Worker 102131: Unknown jobtype: 10
May 3 23:39:31 localhost nagios: wproc: Unknown job type: 10
后来发现是模式的问题。至于原来的模式为啥有问题,网上很多人反映是版本的问题。后来我把模式换成
.Bulk Mode with NPCD 就好了,而且官网文档也是推荐这种的。

参考文档:http://www.kar-chan.com/?p=2267
3.Bulk Mode with NPCD
-
工作原理
从名字上可以看出,这种模式和Bulk是差不多的,只是多了一步将性能数据加上时间戳移到spool目录中等待处理,npcd服务调用process_perfdata.pl对数据进行处理

-
配置参考
编辑nagios.cfg,加入或修改如下选项
process_performance_data=1
# service performance data
#
service_perfdata_file=/usr/local/pnp4nagios/var/service-perfdata
service_perfdata_file_template=DATATYPE::SERVICEPERFDATA\tTIMET::$TIMET$\tHOSTNAME::$HOSTNAME$\tSERVICEDESC::$SERVICEDESC$\tSERVICEPERFDATA::$SERVICEPERFDATA$\tSERVICECHECKCOMMAND::$SERVICECHECKCOMMAND$\tHOSTSTATE::$HOSTSTATE$\tHOSTSTATETYPE::$HOSTSTATETYPE$\tSERVICESTATE::$SERVICESTATE$\tSERVICESTATETYPE::$SERVICESTATETYPE$
service_perfdata_file_mode=a
service_perfdata_file_processing_interval=15
service_perfdata_file_processing_command=process-service-perfdata-file
# host performance data starting with Nagios 3.0
#
host_perfdata_file=/usr/local/pnp4nagios/var/host-perfdata
host_perfdata_file_template=DATATYPE::HOSTPERFDATA\tTIMET::$TIMET$\tHOSTNAME::$HOSTNAME$\tHOSTPERFDATA::$HOSTPERFDATA$\tHOSTCHECKCOMMAND::$HOSTCHECKCOMMAND$\tHOSTSTATE::$HOSTSTATE$\tHOSTSTATETYPE::$HOSTSTATETYPE$
host_perfdata_file_mode=a
host_perfdata_file_processing_interval=15
host_perfdata_file_processing_command=process-host-perfdata-file
编辑commands.cfg,加入或修改如下选项
define command{        command_name    process-service-perfdata-file        command_line    /bin/mv /usr/local/pnp4nagios/var/service-perfdata /usr/local/pnp4nagios/var/spool/service-perfdata.$TIMET$
}
define command{        command_name    process-host-perfdata-file        command_line    /bin/mv /usr/local/pnp4nagios/var/host-perfdata /usr/local/pnp4nagios/var/spool/host-perfdata.$TIMET$
}
这次重装让我更熟悉nagios,很多都忘了,所以还搞了一天!惭愧!
譬如检测存活的 check_alive