在使用了2个月的elasticsearch后,发现单台的elasticsearch的性能实在是无法满足我们的需求,就想到elasticsearch集群,其实elasticsearch的配置还是很简单的。我大致说说。
配置很好的演示
http://www.learnes.net/getting_started/installing_es.html
Marvel 插件 其实我没用,不过觉得挺好的也推荐看下
http://my.oschina.net/xiaohui249/blog/228748
head插件 和 bigdesk插件 挺好用的。
http://www.cnblogs.com/hdflzh/p/4103226.html
比较详细说明elasticsearch配置文件的参数的文章
https://www.elastic.co/guide/en/elasticsearch/reference/current/modules-transport.html
transport 的IP问题,这是我遇到的特殊的一个情况,可以解决我遇到的问题。
安装:
没啥说的。等于安装2个elasticsearch,然后按照上面提示去安装插件。
举例:
(1)head
和插件名字一样,首推这个插件。通过head,可以查看集群几乎所有信息,还能进行简单的搜索查询,观察自动恢复的情况等等。
执行下面的命令开始安装:sudo elasticsearch/bin/plugin -install mobz/elasticsearch-head
记得两台机器都安装一下哦。安装完成之后,在浏览器输入:http://ip:9200/_plugin/head/ ,可以查看显示效果。如下图:
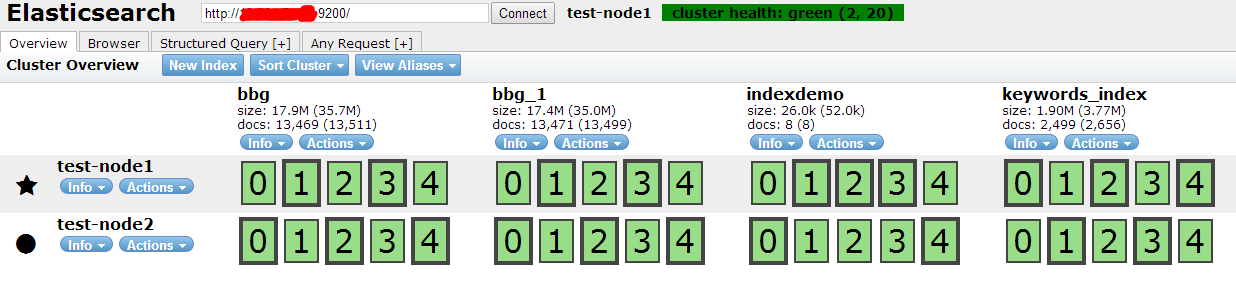
cluster health:green (2, 20) : 表示该集群目前处于健康状态,集群包含2台机器,索引总共20个分片。粗线绿框表示主分片,细线绿框为备份分片。
还有很多功能,请读者自己去体验。
配置:
Node 1:
cluster.name: mycluster
node.name: "node1"
node.master: true
node.data: true
discovery.zen.ping.multicast.enabled: false
discovery.zen.ping.unicast.hosts: ["node1.example.com"]
Node 2:
cluster.name: mycluster
node.name: "node2"
node.master: false
node.data: true
discovery.zen.ping.multicast.enabled: false
discovery.zen.ping.unicast.hosts: ["node1.example.com"]
这个就是关于集群的配置,唯一注意的就是hosts需要定向,或者配置对应的IP。然后启动2个就好了。

配置好后我的集群显示如下。
在实际使用中我遇到个问题,就是kibana3需要访问elasticsearch,这个我在上一篇文章中也说过,但是当时是把publish_address换成外网ip,现在有2台集群需要交互,配置成外网,会影响外网带宽,同时效率也不高,后来通过看文档发现:
transport.tcp.port: 9300
设置节点之间交互的tcp端口,默认是9300。
http.port: 9200
设置对外服务的http端口,默认为9200。
这个大致跟我所了解的对上了,那么我可不可以把9200的访问ip设置成外网方便外面访问,9300的访问设置内网方便节点交互?
去官网发现真的有这类的配置:

那么我就这样设置即可:
network.publish_host: 121.40.143.26 (默认的外网,由于transport指定了,所以其实设置的就是http的9200的访问地址)
transport.publish_host : 10.168.25.125 (内网地址,transport的交互ip)
启动发现果然是这样的。
![]()
这样http的访问就是外网(因为大多数机房跟公司不会在一个内网),节点的交互走内网。皆大欢喜。
不过http的外网传输 还是很耗带宽的。通过kibana3访问还是慢。后期继续研究。
已经保存的面板的迁移,如果之前的面板要移植到新的集群的方式如下:
参考url:http://stackoverflow.com/questions/22048179/location-of-custom-kibana-dashboards-in-elasticsearch
最好的办法就是通过插件把dashboard导入。正如这个url所说:
Yes, the Kibana dashboards are being saved in Elasticsearch under kibana-int index (by default, you can override that in the config.js file). If you want to move your Kibana dashboards to another ES cluster you have two options:
- Export manually the dashboards. Click on Save -> Advanced -> Export Schema. You have to save the file and then in the new Kibana you have to import click over Load -> Advanced -> Choose File and choosing the file that have selected. This is a pain, because you have to do this operation per dashboard that you want to migrate.
- You can use an utility to migrate an ES index from one ES cluster to another. There are some utilities already that can perform this operation. Searching in SO, I found this answer that suggest you to use the Elasticsearch.pm library (Perl :S) to do this. Probably there are more utilities like this but I do not think that doing a script that migrate an index to another cluster is such a difficult task.
EDIT: For the second option, you can use the python elasticsearch library and its helper reindex, if you feel more confortable with Python: https://elasticsearch-py.readthedocs.org/en/latest/helpers.html#elasticsearch.helpers.reindex
但是我找文件找了半天,没找到合适的工具,第一步又太慢,所以我直接把kibana-int 都copy过去了。目前来看dashboard是导入了,但是这个貌似会有很多报错,还有待观察。
![]()
scp kibana-int.tar.gz root@10.168.248.3:/usr/local/elasticsearch/data/elasticsearch_rizhi/nodes/0/indices